
The world of trading and investing revolves around analyzing market trends and understanding patterns. For traders who leverage technical analysis, candlestick patterns are among the most powerful tools for gauging market direction and sentiment. One such important candlestick pattern is the Doji candlestick pattern, which serves as a vital indicator of market indecision and potential reversals.
For traders, understanding the Doji and aligning it with tools like the Market Mood Index can improve decision-making and boost profitability. In this article, we explore the basics of the Doji candlestick pattern, its signals, variations, integration with other indicators, and provide actionable trader tips.
What Is a Doji Candlestick Pattern?
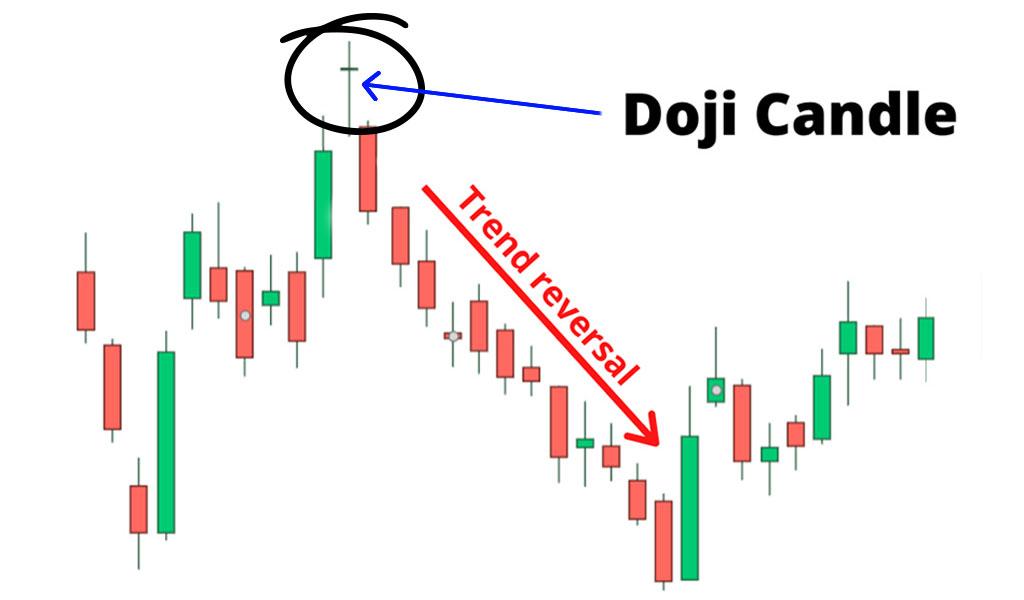
The Doji candlestick pattern is a representation of indecision within the market. It occurs when an asset’s opening and closing prices are very close or equal during a single trading session. This narrow price movement results in a candlestick that looks like a cross or a plus sign. A Doji suggests that neither buyers nor sellers dominate, leading to a stalemate between opposing market forces.
In technical analysis, the appearance of a Doji candlestick often signals that the current trend might be weakening, and traders should watch for potential reversals or continuation patterns in the price movement. It is essential to analyze Dojis in the context of the preceding trend and other signals, as the pattern by itself is not a guaranteed buy or sell signal.
Types of Doji Candlesticks
While the core idea of a Doji candlestick pattern is indecision, the shapes and contextual placement can vary depending on the trading activity within the session. Below are the common types of Doji candlesticks:
- Standard Doji:
Characterized by a tiny body with the opening and closing prices almost identical. The wicks on both sides are generally moderate in length, signifying balanced indecision.
- Long-Legged Doji:
This pattern features long wicks both above and below the candlestick body. It indicates strong price fluctuations during the session, but neither buyers nor sellers are able to dominate.
- Dragonfly Doji:
A Dragonfly Doji has a long lower wick and virtually no upper wick. The pattern suggests that sellers pushed the price down significantly during the session, but buyers regained control and drove the price back to near its opening level. It can signal bullish potential when seen near the end of a downtrend.
- Gravestone Doji:
The Gravestone Doji has a long upper wick with little or no lower wick. This occurs when buyers drive the price higher during the session, but sellers regain control and push the price back down to its opening level. It can indicate bearish potential, especially at the end of an uptrend.
- Four-Price Doji:
This rare type features no visible wicks or a candle body, as all prices (open, close, high, and low) are equal. It occurs during low-volume trading periods and offers limited actionable insights due to lack of movement.
What Does a Doji Candlestick Signal?
The appearance of a Doji candlestick pattern can indicate several key factors depending on its context within the broader market trend. Here’s what traders should consider:
- Trend Reversal:
When a Doji appears after a prolonged uptrend or downtrend, it might signal that the trend is losing momentum and could reverse. For example, a Dragonfly Doji at the bottom of a downtrend often signals bullish reversal opportunities.
- Trend Continuation:
Sometimes, a Doji forms during periods of consolidation within an ongoing trend. In such cases, it serves as a pause before the prevailing trend continues. This signal is more prominent when confirmed by other patterns or indicators.
- Market Indecision:
The primary theme of a Doji is indecision. Neither buyers nor sellers hold a clear advantage, which reflects uncertainty in the market. Indecision in key price areas can be critical for traders, especially when sectors reach psychological support or resistance levels.
- Potential Breakouts:
In ranging or consolidating markets, a series of Dojis can precede a breakout. Traders observing a string of Dojis at key zones should prepare for decisive price action in either direction.
The Role of Market Mood Index in Trading Doji Patterns
Trading Doji candlestick patterns becomes more reliable when combined with sentiment analysis tools like the Market Mood Index (MMI). The Market Mood Index measures the overall sentiment within the market—whether participants are bullish, bearish, or neutral. Incorporating MMI alongside Doji candlestick analysis can enhance decision-making by providing deeper insights into market psychology.
Here’s how you can integrate MMI with Doji patterns:
– Confirming Indecision and Market Sentiment:
A Doji pattern indicates indecision, but the MMI can confirm whether this indecision stems from a neutral sentiment or potential fear/optimism in the market. For example:
– If MMI shows extreme bearishness while a Gravestone Doji appears after an uptrend, traders can anticipate stronger bearish reversals.
– A bullish MMI reading during a Dragonfly Doji at the end of a downtrend further strengthens the outlook for a reversal.
– Identifying Reversal Zones:
The combination of MMI and Doji can help traders spot reversal zones. For instance, when MMI signals an overheating bullish sentiment (extreme greed) and a Doji appears in a strong uptrend, it might signal exhaustion and a pullback.
– Timing Entry and Exit Points:
The Market Mood Index can help confirm whether a Doji suggests a reversal or consolidation. This is essential for timing trade entries and exits more accurately.
Trader Tips for Using Doji Candlestick Patterns
Here are actionable tips that traders can use to maximize the effectiveness of the Doji candlestick pattern:
- Analyze the Context:
A Doji’s significance depends heavily on its position within the broader trend. Always review prior price movements, trend strength, and market volume before drawing conclusions.
- Combine with Technical Indicators:
Use complementary indicators such as RSI (Relative Strength Index), MACD (Moving Average Convergence Divergence), and Bollinger Bands along with Doji patterns for robust analysis.
- Pay Attention to Support and Resistance Levels:
Dojis near key support or resistance levels often indicate meaningful turning points. A Dragonfly Doji near support areas, for example, may signal strong bullish momentum ahead.
- Observe Market Mood Index Values:
Pairing Doji analysis with sentiment indicators like the Market Mood Index gives traders extra confidence. A strongly bearish MMI reading could validate the bearish implications of a Gravestone Doji.
- Avoid Isolated Analysis:
Doji patterns alone are rarely sufficient for trading decisions. Combine them with additional candlestick patterns, volume analysis, and market sentiment tools for higher accuracy.
- Watch for Consequent Candles:
The candlestick following the Doji can provide clarity on the market’s direction. A bullish engulfing pattern after a Doji near support reinforces the case for a reversal, while a bearish candle strengthens the case for a downward continuation.
- Control Risk:
Always use stop-loss orders and position sizing to mitigate risks associated with trading Doji candlestick patterns. Uncertainty can lead to unpredictable price movements, so plan trades carefully.
Final Thoughts
The Doji candlestick pattern is a potent tool for traders, especially when used in conjunction with broader technical analysis and sentiment indicators like the Market Mood Index (MMI). Its ability to reveal market indecision and potential reversals makes it valuable, but traders should not rely on it in isolation. Success lies in understanding the broader market context, combining tools, and practicing disciplined risk management.
By mastering Doji candlesticks and integrating advanced analysis tools, traders can better navigate the complexities of trading and seize profitable opportunities even in uncertain market conditions. Whether you’re a novice or an experienced trader, learning to read and interpret the signals of a Doji can elevate your trading knowledge and improve your strategy execution.